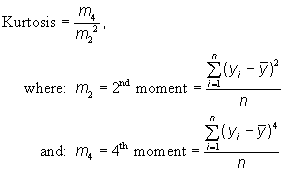
![]()
Field Summary Statistics: |
|

This function produces similar values to those produced
by the “Summarize” function in the “Field” menu, except with a few more
options and a higher level of precision. Open the “Summary Statistics”
dialog by opening your table, selecting the field you are interested in,
and then clicking on the
![]() button. This button will not be enabled unless a
numeric field has been selected. Then, select your summary statistics and
click “OK”. The output will open in a Report window and the data will
automatically be copied to the clipboard for you to paste into other
applications.
button. This button will not be enabled unless a
numeric field has been selected. Then, select your summary statistics and
click “OK”. The output will open in a Report window and the data will
automatically be copied to the clipboard for you to paste into other
applications.
This tool is designed with a dialog interface to make it easy for users to get and view a variety of statistics describing a set of data. This tool can also be accessed with Avenue code which enables more advanced users to pass these statistics to variables, and then use the calculated values in other places. Please review Calculating Summary Statistics with Avenue for details on how to do this.
|
|||
|
|||
|
|||
|
|||
|
|||
|
|
|||
|
|||
|
Maximum - Minimum | ||
|
 |
||
|
 |
||
|
 |
||
|
|||
|
|
|||
|
|||
|
|
|||
|
|||
|
|
|||
|
|||
|
|
|||
|
|||
|
|||
|
|||
![]()
Back to Statistics/Distributions | Probability Calculators | References
Calculating Summary Statistics with Avenue
Discussion of Distribution Functions:
Probability Density Functions | Cumulative Distribution Functions |
Quantile Functions
Download Statistics Extension Manual (Adobe PDF, version 5)
![]()
Please visit Jenness Enterprises ArcView Extensions site for more ArcView Extensions and other software by the author. We also offer customized ArcView-based GIS consultation services to help you meet your specific data analysis and application development needs.


